 |
The United States is
among the world's largest sugar producers. Unlike most other producing
countries, the United States has both large and well-developed sugarcane
and sugar beet industries. Since the mid-1990s, sugarcane has accounted
for about 46 percent of the total sugar produced domestically, and sugar
beets for about 54 percent of production. U.S. sugar production expanded
from an early 1980s' average of 6.0 million short tons, raw value (STRV)
to an average 8.4 million STRV in the 2000s. The production increases
are due to a substantial investment in new processing equipment, the
adoption of new technologies, the use of improved crop varieties, and
acreage expansion (because of higher prices for sugar relative to
alternative crops). |
Sugarcane and sugar
beet yields can vary widely from year to year due to weather, but
both have tended to grow over time. The growth of sugarcane yields has
been particularly impressive in Florida and Louisiana due to varietal
improvements, investments in improved harvesting technologies, and other
technological changes. Sugar beet yields have ranged from a low of 18.6
short tons per acre in fiscal year (FY) 1993 to a high of 22.7 tons per
acre in FY 2003.
The number of
farms growing sugarcane and sugar beets declined from 1997 to 2002,
but the average area harvested per farm increased.
According to the 2002 Census of Agriculture, the number of farms growing
sugar beets and sugarcane decreased from 8,136 in 1997 to 5,980 in 2002.
The number of farms growing sugar beets declined from 7,057 to 5,027,
while average area harvested per farm rose from 205 to 272 acres. The
number of sugarcane farms dropped from 1,079 to 953, while average area
harvested grew from 825 to 1,027 acres per farm.
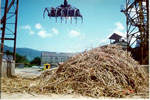 |
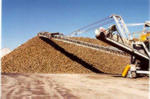
Sugarcane
production. Sugarcane is
one of the essential raw material sources of manufactured sugar in the
United States. Sugarcane, a tall perennial grass, is grown in tropical
and semitropical climates. After the planting of cane stalk cuttings,
the plant matures in 1-2 years. Two to four crops are harvested from the
original plantings, unless the plants are impaired or destroyed by
frost, disease, or other causes. Once harvested, sugarcane must be
processed quickly before its sucrose deteriorates. |
In the United
States, sugarcane is produced in Florida, Louisiana, Hawaii, and Texas.
Acreage of sugarcane for sugar rose from an average 704,000 acres in the
first half of the 1980s to 948,000 acres in the 2000s. Over the same
period, sugar produced from sugarcane grew from 2.9 million STRV to 3.9
million STRV.
Florida's sugarcane
production has expanded significantly since the United States ceased
importing sugar from Cuba in 1960. Florida is the largest cane-producing
region in the United States. Most of the sugarcane is produced in
organic soils along the southern and southeastern shore of Lake
Okeechobee in Southern Florida, where the growing season is long and
winters are generally warm. Florida has produced an average 2.0 million
STRV of sugar in the 2000s.
In Louisiana, the
northernmost cane-growing State, sugarcane production has been largely
confined to the Delta, where soils are fertile and the climate is warm.
However, the sugar industry in Louisiana has been expanding northward
and westward into nontraditional sugarcane growing areas. Most of the
expansion in sugarcane acreage in recent years has occurred as returns
for competing crops, such as rice and soybeans, have decreased.
Louisiana production has also expanded due to the adoption of
high-yielding sugarcane varieties, along with investments in new
harvesting combines. Louisiana has produced an average 1.4 million STRV
of sugar in the 2000s.
Texas sugarcane is
produced in the lower Rio Grande Valley in the southern tip of the
State. The area has a subtropical climate—long, hot summers and short,
mild winters. Killing freezes are a recurrent threat, and hurricane and
drought have significantly reduced production in some years. Production
of sugarcane in Texas resumed with the 1973 crop after years of
inactivity. During the 1980s, total harvested area averaged about 35,000
acres and varied little. Sugarcane production averaged about 100,000
tons per year for the same period, but varied from year to year due to
changes in yields. FY 2001 saw a 50-percent expansion in sugarcane
acreage from the previous year. Area harvested has averaged about 44,000
acres in the 2000s and sugar produced has averaged 185,000 STRV.
Hawaii's sugarcane
production until recently was spread across the islands of Hawaii,
Kauai, Maui, and Oahu, but closures of processing plants and competing
uses for sugar land have reduced sugar production to two mills on Maui
and Kauai. Sugarcane area harvested in Hawaii has decreased from close
to 100,000 acres in FY 1981 to an average 21,000 acres in the 2000s. The
State's sugar production has declined from over 1.0 million tons in the
first half of the 1980s to 259,000 tons in the 2000s.
Sugar beet
production. Sugar beets
are the other leading raw material for manufactured sugar in the United
States. Sugar beets, a sturdy crop grown in a wide variety of temperate
climatic conditions, are planted annually. In the United States, sugar
beets are grown in the hot climate of the Imperial Valley of California,
as well as in the colder climates of Minnesota, Montana, and North
Dakota. Sugar beets can be stored for a short while after harvest, but
must soon be processed before sucrose deterioration occurs.
Sugar beets
basically are grown in five regions encompassing 12 States, and tend to
be grown in rotation with other crops. Two of the regions are east of
the Mississippi River, while the three other areas are in the Great
Plains and Far West. The western regions represent dryland farming that
is dependent on irrigation as a primary source of water. The eastern
regions depend on rainfall. Sugar beet yields in the western areas tend
to be higher than in the east, but production costs tend to be higher as
well. In all areas, sugar production is enhanced by technologies that
allow the desugaring of molasses that otherwise would be a relatively
low-value byproduct.
The largest and most
dynamic region for sugar beet production is in or close to the Red River
Valley of western Minnesota and eastern North Dakota. Area planted in
the Red River region has been growing consistently through the 1990s and
has averaged 734,000 acres in the 2000s, or about 51 percent of total
planted U.S. sugar beet acreage. Long, cold winters aid the storage of
sugar beets harvested in October and allow the slicing of sugar beets
well into the following spring, thereby making more efficient use of
slicing capacity at the factories. A second area of sugar beet
production is in the eastern United States in Michigan and Ohio. Area
planted in this region in the 2000s has averaged 183,000 acres, or about
13 percent of total U.S. acreage.
Sugar beet
production occurs in the Upper Great Plains (north central Wyoming,
Montana, and western North Dakota) and Central Grain Plains
(southeastern Wyoming, Colorado, and Nebraska). Area planted in the
Great Plains has averaged 222,000 acres, or about 15 percent of national
area planted.
Sugar beet
production in the Northwest occurs in Idaho, Washington State, and
portions of Oregon. Area planted for the 2000s has averaged about
231,000 acres, or about 16 percent of total area. California comprises
the Far Western region with an average area planted of 61,000 acres in
the 2000s. Area planted in the Far Western region has contracted from
about 100,000 acres in the 2000 crop year to about half that total in
following years due to the closure of two processing plants in northern
California.
Annual cash
receipts. Cash receipts for
U.S. sugar growers vary with sugar yields and prices. Cash receipts for
sugar beets were $1.10 billion in the 2002/03 crop year and $1.27
billion in the 2003/04 crop year. Sugarcane cash receipts were $962,000
in the 2002/03 crop year and $944,000 in the 2003/04 crop year. On
average, the sugar crops account for 1 percent of the cash receipts
received by U.S. farmers for all agricultural commodities.
U.S. and World Sugar Prices
The two key sugar
prices in the United States are the raw cane sugar price and the refined
beet sugar price. The raw cane sugar price is based on the price of
sugar delivered to New York and is quoted at the New York Board of Trade
as the Sugar Number 14 (domestic) Contract. There is no futures market
for U.S. refined sugar, but a price range for wholesale Midwest refined
beet sugar, f.o.b. (free on board) factory, is quoted each week in
Milling and Baking News. During the 2000s, the raw sugar
price has ranged between a low average of 19.09 cents a pound in 2000
and a high average of 21.42 cents a pound in 2003. The wholesale beet
price has likewise ranged from an average of 20.80 cents a pound in 2000
to an average of 26.21 cents a pound in 2003.
U.S. sugar prices
have been well above world prices since 1982 because the U.S. Government
supports domestic sugar prices through loans to sugar processors and,
beginning in FY 2003, a marketing allotment program. The raw cane sugar
price, which is based on a bulk spot price for sugar stowed in Caribbean
ports, including Brazil, is quoted at the New York Board of Trade as the
Sugar Number 11 (world) Contract. The raw cane sugar price has averaged
about 8.33 cents a pound during the 2000s.
A world refined
sugar price, the Number 5 Contract on the London International Financial
Futures and Options Exchange, is based on the London daily spot market
price for refined sugar f.o.b. ship in European ports. The refined beet
sugar price has averaged about 10.44 cents a pound during the 2000s.
High-Fructose Corn Syrup Production and Prices
High fructose corn
syrup (HFCS) is one of several products—along with glucose, dextrose,
corn starch, ethanol, and other products—derived from the wet milling of
corn. U.S. corn refiners produce high fructose corn syrup by first
converting corn starch to a syrup that is nearly all dextrose. Enzymes
isomerize the dextrose to produce a 42-percent fructose syrup called
HFCS-42. By passing HFCS-42 through an ion-exchange column that retains
fructose, corn refiners draw off 90-percent HFCS and blend it with
HFCS-42 to make a third syrup, HFCS-55.
Demand for HFCS is
driven by demand for products that use the syrups as inputs. For
HFCS-55, the major use is in the beverage industry, which demands over
90 percent of total domestic deliveries. Major food users of HFCS-42
include the beverage industry (44 percent), processed food manufacturers
(21 percent), cereal and bakery producers (13 percent), multiple-use
food manufacturers (13 percent), the dairy industry (7 percent), and the
confectionery industry (1 percent). Growth in these sectors has
typically accounted for growing sales of HFCS-55 and HFCS-42. Supersweet
HFCS-90 is used in natural and "light" foods where very little is needed
to provide sweetness.
Domestic
production of HFCS
increased from 2.2 million short tons in 1980 to an average of 9.2
million tons, dry weight, during the 2000s as HFCS replaced more
expensively priced sugar in a variety of uses. In 1997, corn used to
produce HFCS broke through the 500-million bushel level. It is estimated
that, in the 2000s, about 533 million bushels of corn, or about 5
percent of the total U.S. corn crop, has been be used to produce HFCS.
U.S. Sweetener Deliveries
Deliveries of sugar
and other sweeteners have averaged about 21 million tons during the
2000s. Other sweetener deliveries include corn sweeteners (high fructose
corn syrup, glucose syrup, and dextrose), honey, maple syrup, and other
edible syrups but exclude the deliveries of noncaloric sweeteners.
Per capita
deliveries of caloric sweeteners increased by 32 pounds, or 27 percent,
from 1970 to 151.3 pounds in 1999. Since 1999, per capita sweetener
deliveries have decreased by 9.8 pounds to 141.5 pounds in 2003. Sugar
and sweeteners have maintained a 36- to 40-percent share of the steadily
growing U.S. per capita consumption of carbohydrates.
Sugar Futures
Information
Minimum Price
Movement
1/100 cent/lb.,
equivalent to $11.20 per contract.
Daily Price Limit
None
Sugar Futures
Last Trading Day
Last business day of
the month preceding deliverly month.
Sugar Futures
First Notice Day
1st business day
after the last trading day.
Sugar Futures
Last Notice Day
1st business day
after the last trading day
Contract
Symbol
B
Sugar Futures Contract Size
112,000 pounds (50 long
tons)
Sugar Futures Contract Months
March, May, July,
October
Contract Settlement
Physical
Delivery
Sugar Futures Trading Hours
9:00 am to 12:00 pm;
pre-open commences at 8:50 a.m.; closing period commences at 11:58 am
(electronic trading hours: 1:30 a.m. - 3:15 p.m. ET)
Price Quotation
Cents per
pound |